LedgerIQ Basic
LedgerIQ is our financial analysis module, available on Pro plans and above:
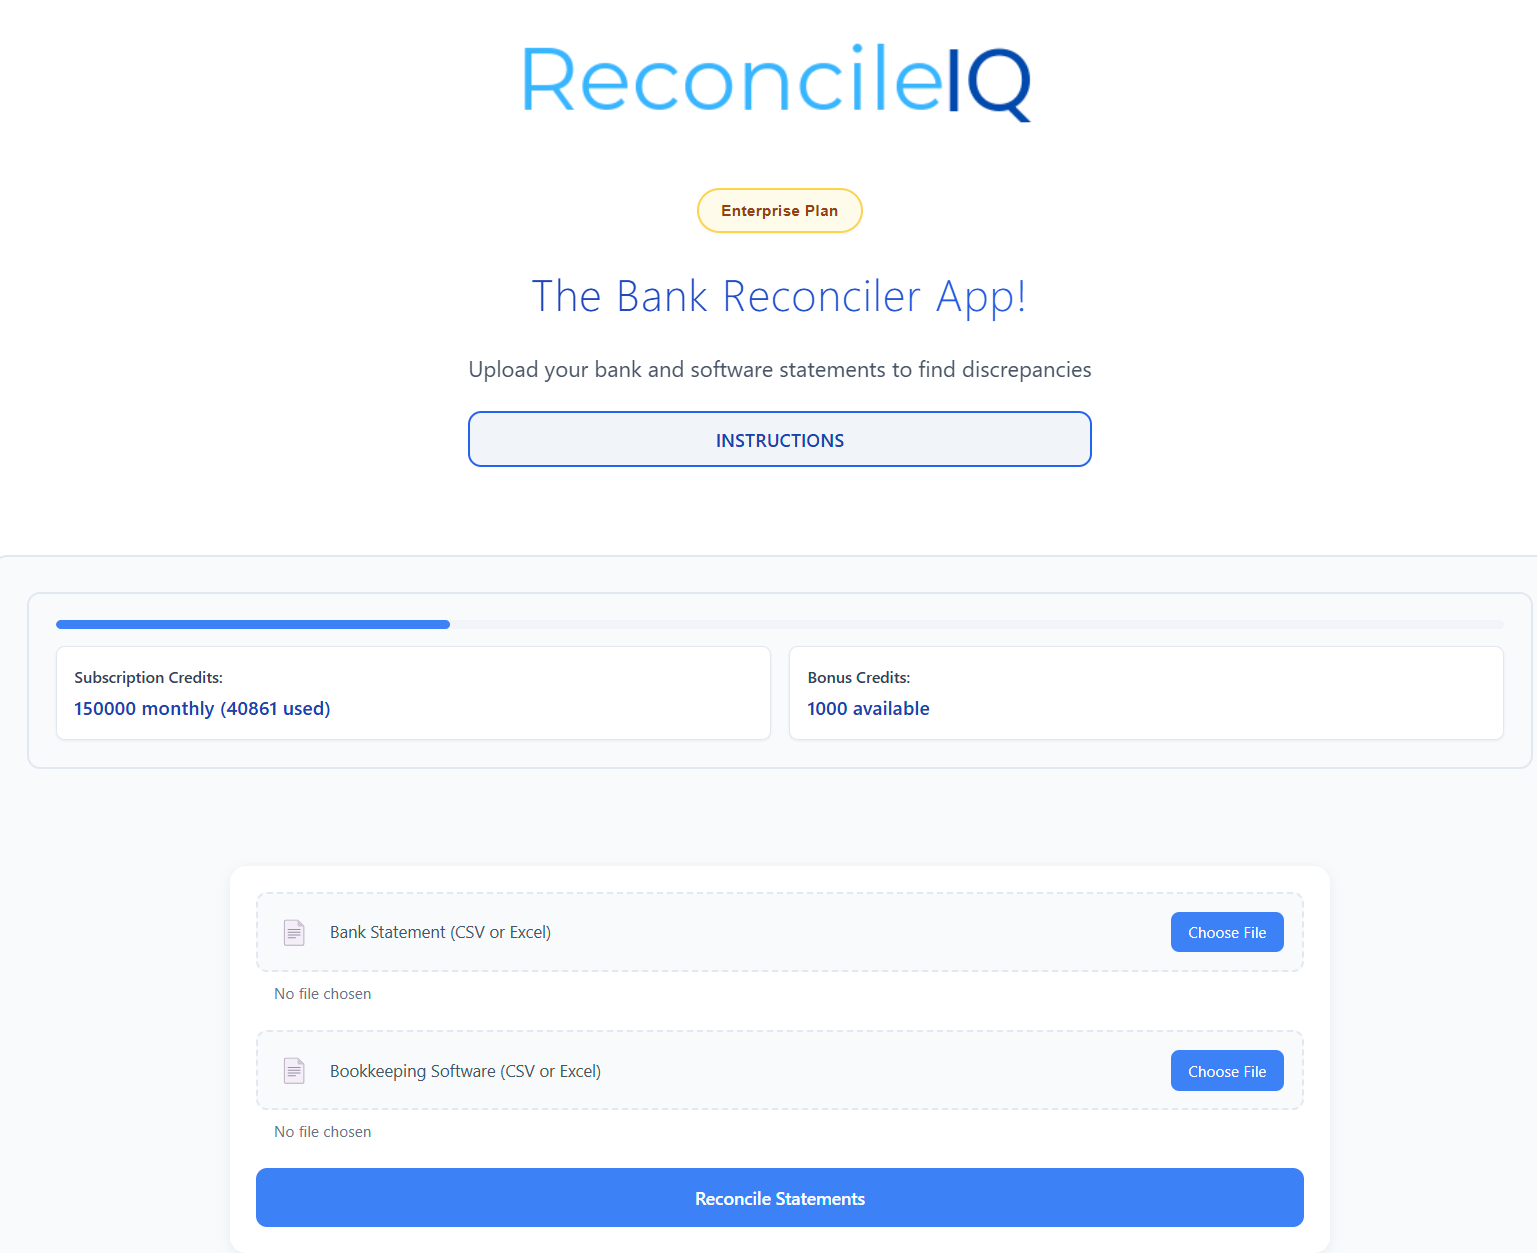
- Click the "LedgerIQ" tab in the main navigation
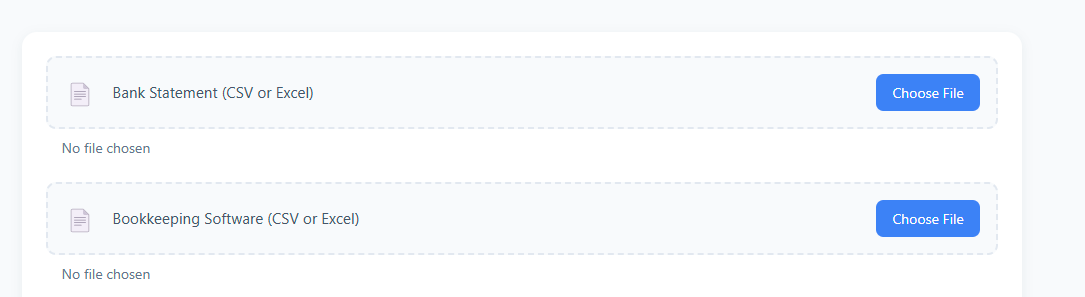
- Upload your general ledger file (CSV, XLS, or XLSX)
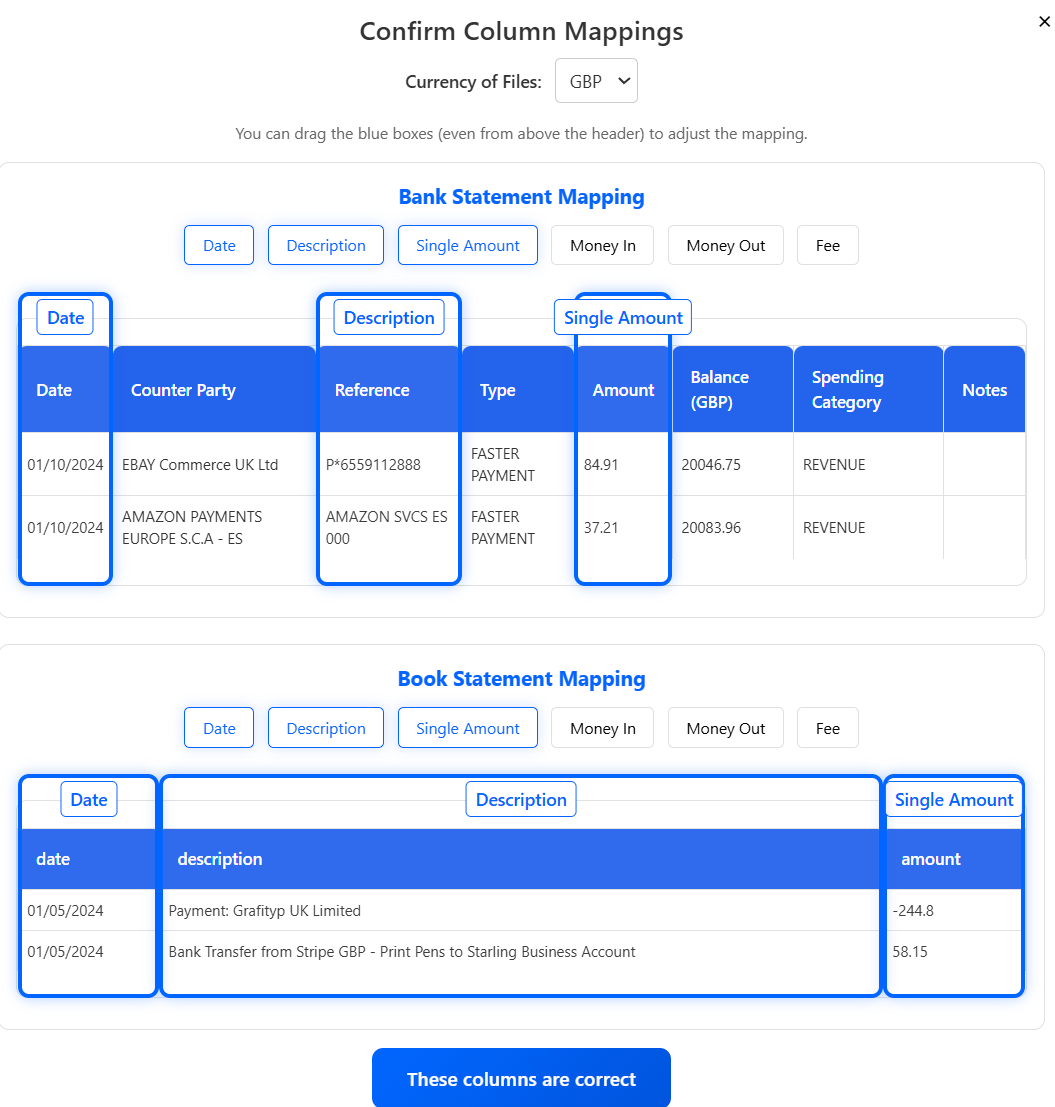
- Map the columns as prompted
- Click "Generate Analysis" to process your data
Note:
Basic LedgerIQ features are available on Pro plans and above.
LedgerIQ Basic provides these key financial insights:
- Income Overview: Total revenue, expenses, and net income
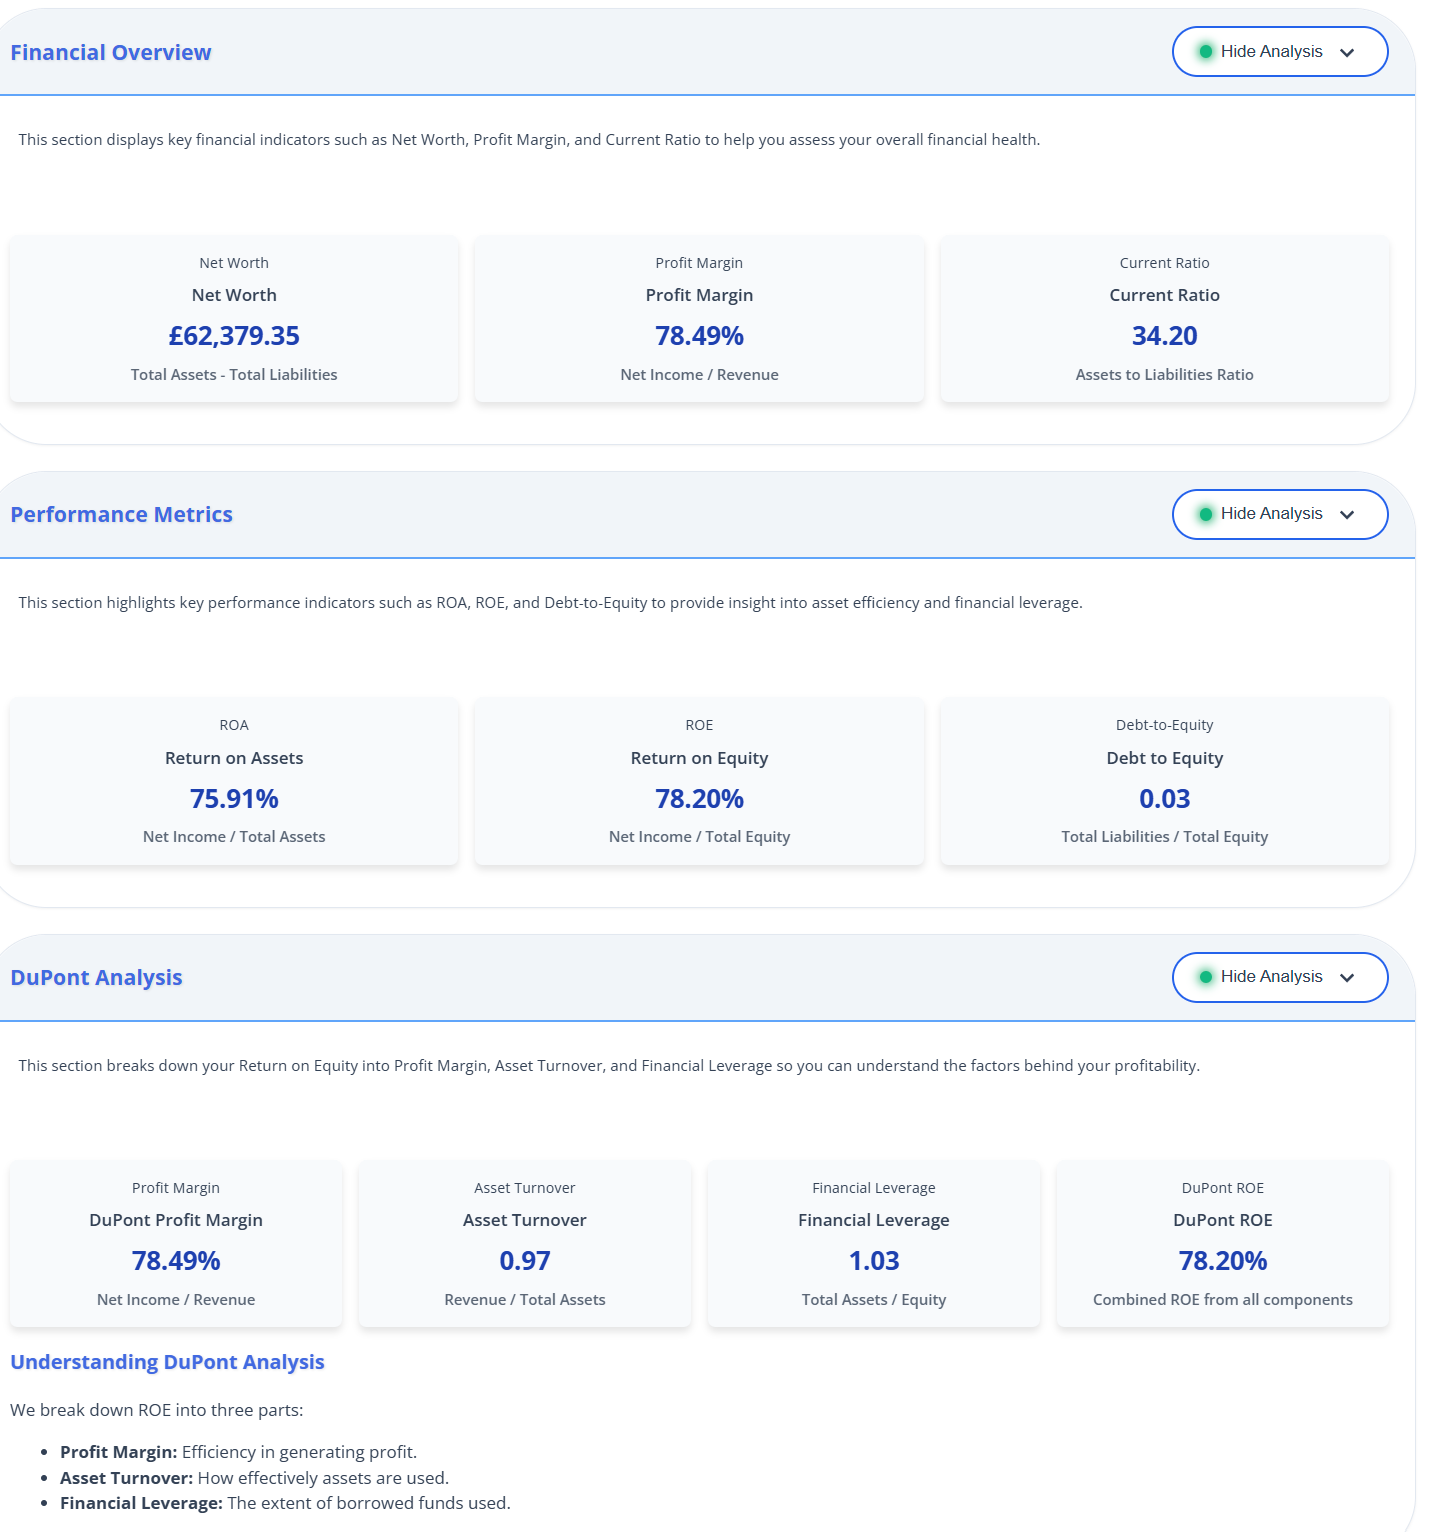
- Financial Overview: Net worth, profit margin, and current ratio
- Performance Metrics: ROA, ROE, and debt-to-equity ratio
- DuPont Analysis: Breakdown of ROE components
- Expense Analysis: Visual breakdown of expense categories
Each section can be expanded to view detailed information and visualizations.
To make the most of LedgerIQ Basic insights:
- Click on each section card to expand and view details
- Hover over metrics for explanatory tooltips
- Review visualizations to identify patterns and trends
- Use the insights to inform financial decision-making
- Check these metrics regularly to track financial health
Pro Tip:
Pay particular attention to the DuPont analysis, which breaks down your return on equity into components that can reveal opportunities for improvement.
LedgerIQ Advanced
LedgerIQ Advanced, available on Business and Enterprise plans, provides deeper financial insights:
- Revenue Forecast: Predictive analysis of future revenue trends
- Expense Anomalies: Detection of unusual spending patterns
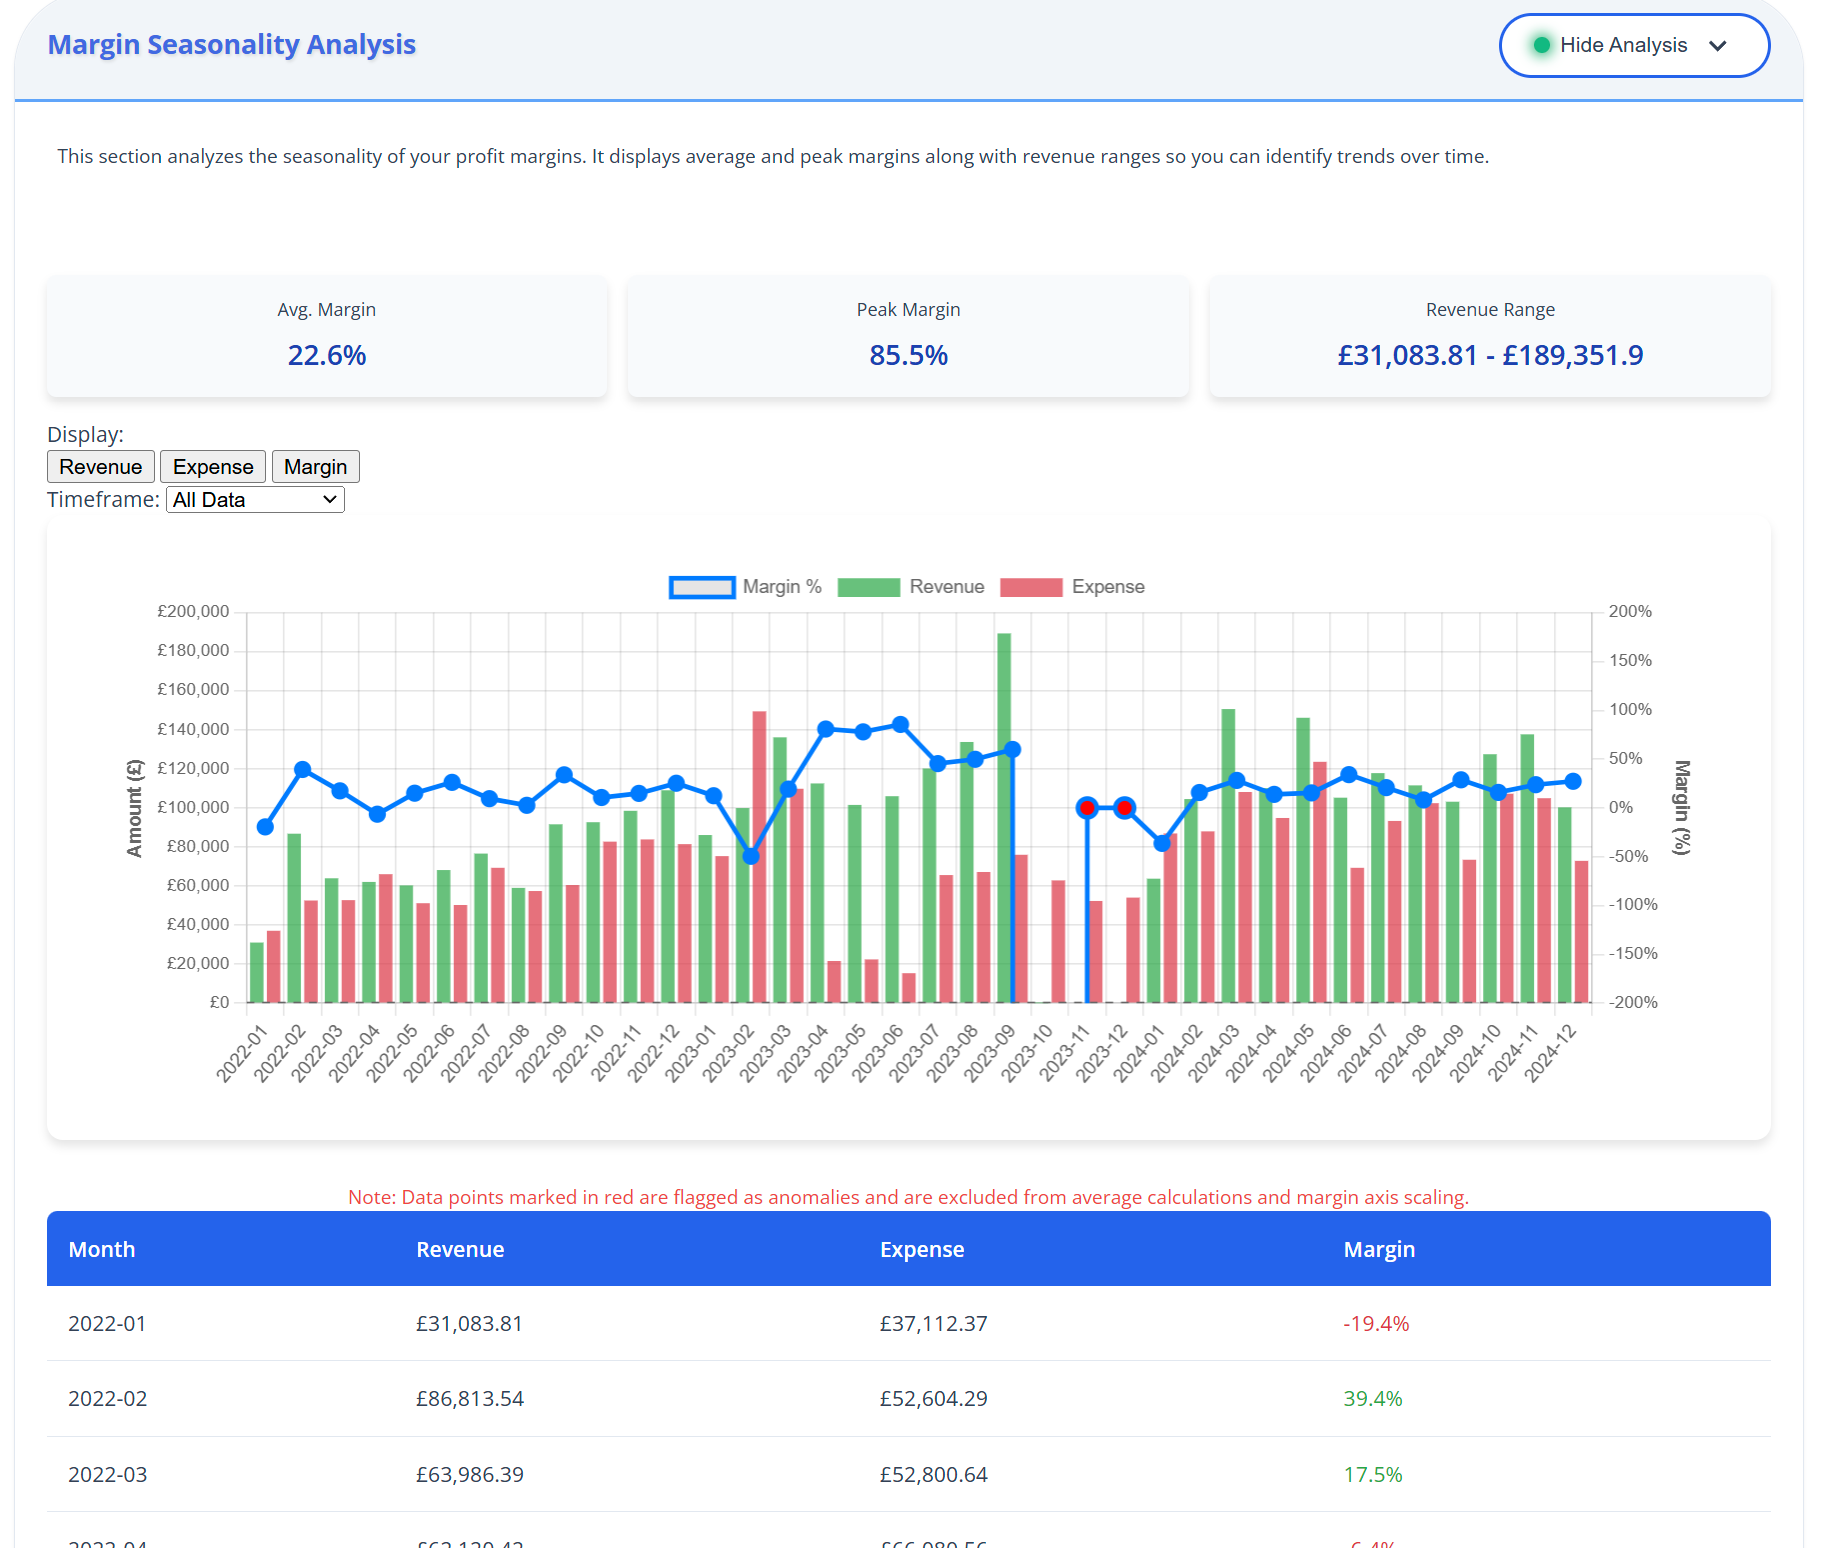
- Margin Seasonality: Analysis of profit margin fluctuations over time
- Break-Even Analysis: Interactive tool to determine break-even points
- Expense Correlation: Identification of relationships between expenses and revenue
Note:
These advanced features are only available on Business and Enterprise plans.
The Revenue Forecast tool provides predictive insights:
- Analyzes historical revenue data to project future trends
- Shows average growth rate and expected future revenue
- Provides high and low range forecasts
- Includes a 6-month forecast table with detailed projections
Use these projections for budgeting, planning, and setting financial goals.
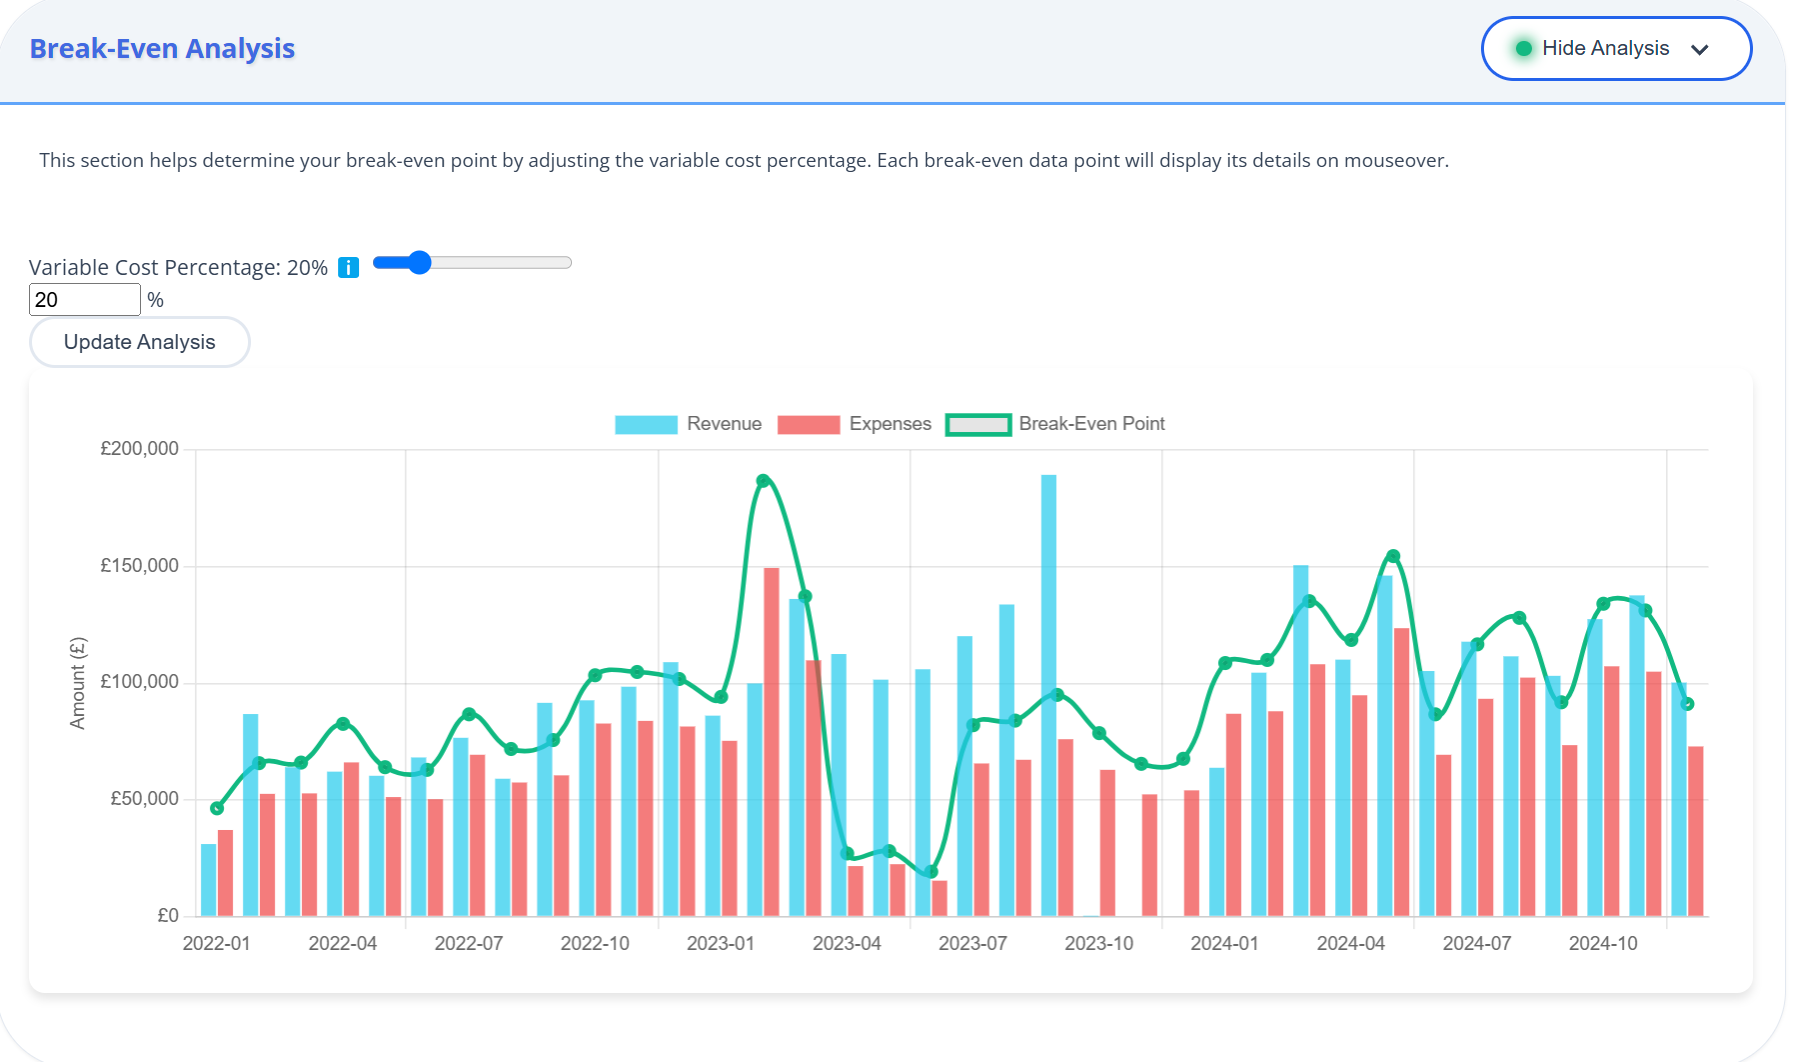
The interactive Break-Even Analysis tool helps you understand your financial requirements:
- Adjust the variable cost percentage using the slider
- See how different cost structures affect your break-even point
- View the calculation in both tabular and chart format
- Use these insights for pricing strategies and financial planning
Pro Tip:
Try different variable cost percentages to see how changes in your business model might affect profitability.
These tools help you understand spending patterns and identify issues:
- Expense Correlation: Shows how different expense categories relate to revenue
- Expense Anomalies: Identifies unusual spending that deviates from normal patterns
- Use sorting and filtering options to focus on key insights
- View visualizations to quickly spot significant correlations and outliers
These insights can help optimise spending and identify potential areas for cost reduction.